Great Pacific Garbage Patch – Size, Location, Causes and Cleanup Facts
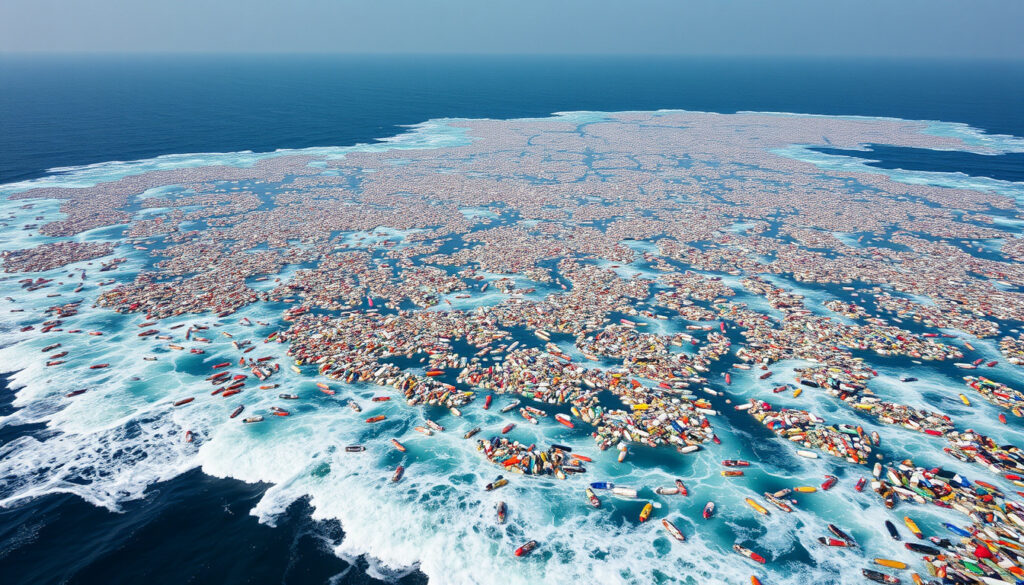
The Great Pacific Garbage Patch represents the world’s most visible accumulation of ocean plastic, a sprawling zone where currents concentrate debris from across the Pacific. Located between Hawaii and California, this phenomenon has grown from an observed curiosity in 1997 to a defining environmental challenge of the 21st century.
Stretching across an area roughly twice the size of Texas, the GPGP contains an estimated 1.8 trillion pieces of plastic weighing approximately 100,000 tonnes. Scientists estimate concentrations reaching hundreds of kilograms per square kilometer at the densest points. The patch continues expanding despite cleanup efforts, with 2024 marking a record year for debris removal while overall mass remains unchanged.
Understanding this environmental phenomenon requires examining its formation, scale, impacts, and the ongoing efforts to address one of the ocean’s most pressing pollution challenges.
What Is the Great Pacific Garbage Patch?
The Great Pacific Garbage Patch constitutes the world’s largest offshore plastic accumulation zone. This term describes an area where floating debris becomes trapped by ocean currents rather than a solid mass of trash. The region exists within the North Pacific Subtropical Gyre, a system of rotating currents that draws plastic from coastlines across the Pacific and beyond.
Unlike a visible landfill, the patch consists of diffuse plastic suspended throughout the water column. Some debris floats at the surface while other pieces break into microplastics that mix throughout the water. Larger objects, including abandoned fishing gear stretching over 50 feet, concentrate in areas of highest density.
Discovery and History
Captain Charles Moore first brought widespread attention to this phenomenon in 1997. While sailing from Hawaii to California following a yacht race, Moore encountered an unexpected expanse of floating plastic debris where he expected to find empty ocean. His subsequent reporting and research established the GPGP as a significant environmental concern.
Evidence suggests plastic accumulation in this gyre began as early as the 1970s, with concentrations increasing exponentially since that time. The 2024 estimates indicate approximately 1.8 trillion pieces of plastic, a figure that has grown continuously despite efforts to reduce ocean pollution.
North Pacific Ocean between Hawaii and California
Approximately 1.6 million square kilometers
80% plastics; 92% objects larger than 0.5 cm
1997 by Captain Charles Moore
- Contains an estimated 1.8 trillion plastic pieces, with potential range of 1.1 to 3.6 trillion
- Weighs approximately 100,000 tonnes, equivalent to over 740 Boeing 777 aircraft
- 94% of individual pieces consist of microplastics measuring under 0.5 centimeters
- Nearly half of the mass comprises synthetic fishing nets
- Plastic outnumbers marine life 180 times at the ocean surface
- Microplastic concentrations have increased exponentially since the 1970s
- 70% of marine debris eventually sinks below the surface
| Metric | Estimate | Context |
|---|---|---|
| Surface Area | 1.6 million km² | Twice the size of Texas; three times the size of France |
| Total Weight | 100,000 tonnes | Equivalent to 740+ Boeing 777s |
| Piece Count | 1.8 trillion (mid-range) | Range: 1.1 to 3.6 trillion pieces |
| Center Coordinates | 32°N, 145°W | Seasonal shifts of hundreds of kilometers |
| Peak Density | Hundreds of kg/km² | At center; 10 kg/km² at edges |
| Macroplastics (>5 cm) | 75% of total mass | Majority of visible debris |
| Microplastics (<0.5 cm) | 94% by count | Smallest fraction by mass |
| Fishing Nets | ~50% of mass | Largest single category |
Where Is the Great Pacific Garbage Patch Located?
The Great Pacific Garbage Patch occupies a region in the North Pacific Ocean positioned roughly between Hawaii and the United States mainland. Its center orbits around coordinates 32°N latitude and 145°W longitude, though these figures represent averages rather than fixed boundaries.
The North Pacific Subtropical Gyre
This accumulation zone exists within the North Pacific Subtropical Gyre, one of five major oceanic gyres worldwide. These gyres consist of large systems of circulating ocean currents driven by global wind patterns and the rotation of the Earth. The North Pacific Gyre spans an enormous area from the Equator to beyond 50°N latitude and from the Asian coast to North America.
Within this gyre, the Subtropical Convergence Zone creates a region where surface waters converge, trapping floating materials at the center. Plastics and other debris entering the gyre from any coastline within its vast drainage area eventually spiral toward this convergence zone. No single nation bears responsibility for the GPGP, as its location in international waters means the debris originates from numerous countries across multiple continents.
The GPGP has no fixed borders. Its shape and exact boundaries shift seasonally due to winds and currents. Models based on aerial surveys and simulations show a vortex-shaped zone with density highest at the center. Some reports confuse satellite visibility with constant observation; while portions are detectable by satellite in dense areas, the diffuse microplastic nature makes the patch far less prominent than popular imagery suggests.
How Big Is the Great Pacific Garbage Patch?
Current estimates place the GPGP at approximately 1.6 million square kilometers, making it roughly twice the size of Texas or three times the area of France. This figure has remained relatively stable in recent years, though scientists note that measuring a diffuse, shifting accumulation zone presents significant challenges.
Current Estimates and Measurement Challenges
The 1.6 million km² measurement refers specifically to the zone where plastic concentration exceeds certain thresholds. At the densest central areas, concentration can reach hundreds of kilograms per square kilometer. At the edges, this drops to approximately 10 kg/km². The transition between patch and surrounding ocean remains gradual rather than distinct.
Weight estimates hover around 100,000 tonnes for floating debris. This represents only the material that remains at or near the surface. Research indicates that approximately 70% of marine debris eventually sinks, meaning the total plastic input likely far exceeds what scientists can directly measure through surface surveys.
Growth Trends and Projections
A June 2025 report confirmed persistent growth in the patch, with estimates now ranging up to 3.6 trillion pieces. Microplastic concentrations have shown exponential increases since the 1970s, driven by ongoing plastic inputs exceeding what cleanup operations can remove. Despite record extraction years, scientists have not documented significant reductions in overall patch size.
The 100,000 tonnes of floating debris in the GPGP represents only a fraction of total plastic entering the North Pacific. Scientists estimate that inputs continue outpacing removals, meaning the patch would grow even without additional pollution sources. The 70% of debris that sinks adds unknown quantities to the problem below the surface.
What Causes the Great Pacific Garbage Patch?
The North Pacific Subtropical Gyre drives the formation and maintenance of the Great Pacific Garbage Patch. This circular current system acts as a slow-moving conveyor belt, drawing water and floating debris from across the Pacific Rim toward its center. The gyre’s rotational dynamics create a zone of convergence where floating materials accumulate over time.
Plastics enter this system from numerous sources. Coastal communities and fishing vessels contribute directly to gyre pollution. River systems carry land-based waste from inland areas hundreds or thousands of miles away. Industrial shipping operations, recreational vessels, and aquaculture facilities add to the debris stream. The GPGP contains fragments of consumer products, packaging materials, and the largest single contributor: abandoned fishing gear.
Once plastic enters the gyre, its persistence determines the accumulation pattern. Unlike organic materials that degrade and decompose, plastic persists for centuries. It fragments into smaller pieces through wave action and UV exposure but never fully disappears. This permanence means every piece of plastic ever produced that reaches the ocean remains somewhere in the environment.
What Are the Impacts of the Great Pacific Garbage Patch?
The environmental consequences of this plastic accumulation extend throughout marine ecosystems. Surface plastics outnumber marine organisms by a ratio of approximately 180 to 1 in the most concentrated areas. This abundance creates multiple pathways for harm, from direct ingestion to habitat alteration.
Wildlife and Ecosystem Damage
Marine animals face immediate threats from plastic ingestion. Studies of sea turtles captured in nearby fisheries revealed that up to 74% of their diets by dry weight consisted of plastic. Laysan albatross chicks on Kure Atoll and Oahu showed plastic comprising 45% of their body mass by wet weight. These statistics represent only documented cases; countless other animals suffer similar fates unreported.
Larger debris poses entanglement risks for marine mammals, seabirds, and slow-moving species like sea turtles. Abandoned fishing nets, which constitute nearly half of the GPGP’s mass, present particular danger as ghost gear that continues trapping animals without human oversight. Microplastics, though representing only a small fraction of total mass, comprise 94% of individual pieces and enter food chains at the most fundamental levels.
Microplastics darken ocean surfaces, potentially affecting sunlight penetration and photosynthesis in surface-dwelling organisms. These smallest fragments enter marine food webs at their foundation, with unknown long-term consequences for ecosystem stability. The exponential increase in microplastic concentrations since the 1970s suggests effects will intensify before any improvement becomes measurable.
What Cleanup Efforts Target the Great Pacific Garbage Patch?
Cleaning the GPGP presents extraordinary technical and logistical challenges. The patch’s remote location in international waters, its enormous area, and the diffuse nature of the debris all complicate removal efforts. NOAA estimates that 67 ships working continuously for a full year would remove less than 1% of the patch’s mass. Traditional methods using nets risk entangling marine life and prove impractical for the scale involved.
The Ocean Cleanup Project
The Ocean Cleanup organization leads current efforts with technology specifically designed for the GPGP. Their System 03 platform uses passive collection, allowing currents to concentrate debris while screens collect floating plastic. This approach avoids the marine entanglement risks of traditional netting while maximizing efficiency.
In 2024, the organization achieved 112 extractions from the GPGP, removing more trash than all previous years combined. This represented a significant milestone in scaling cleanup operations. The system prioritizes larger debris, including the fishing nets that constitute roughly half of the patch’s mass. No nation has committed to funding full-scale cleanup due to the scale and remoteness of the zone.
Global Initiatives and Limitations
Beyond direct removal, international initiatives address marine debris through prevention and monitoring. Organizations track debris sources, advocate for source reduction policies, and develop technologies for at-sea collection. The challenge remains that current cleanup capacity cannot match the rate of new plastic entering the ocean.
The GPGP contains approximately 100,000 tonnes of floating debris, yet annual cleanup operations measured in hundreds of tonnes represent remarkable progress by historical standards. Even with successful scaling, scientists emphasize that source mitigation—stopping plastic before it enters the ocean—remains essential. Cleanup addresses symptoms; prevention addresses causes.
A Timeline of the Great Pacific Garbage Patch
- — Plastic presence in the North Pacific Gyre documented by early researchers, with concentrations beginning exponential growth
- — Captain Charles Moore discovers extensive floating debris while sailing from Hawaii to California
- — Scientific surveys quantify the patch’s size and composition, establishing baseline measurements
- — The Ocean Cleanup organization founded with mission to develop scalable ocean cleanup technology
- — The Ocean Cleanup launches first systems into the GPGP for testing
- — System 03 deployed, representing significant advancement in collection technology
- — Record 112 extractions achieved, more trash removed than all prior years combined
- — Report confirms persistent growth with estimates up to 3.6 trillion pieces
What We Know versus What Remains Unclear
Established Information
- The GPGP forms within the North Pacific Subtropical Gyre due to current patterns
- Size estimates place the zone at approximately 1.6 million square kilometers
- The patch contains roughly 1.8 trillion pieces weighing about 100,000 tonnes
- 92% of mass consists of objects larger than 0.5 centimeters
- 94% of individual pieces are microplastics under 0.5 centimeters
- Nearly half the mass comprises synthetic fishing nets
- Captain Charles Moore first brought attention to the phenomenon in 1997
- Plastic presence dates to at least the 1970s
- Wildlife ingestion documented through scientific studies
- 2024 marked record extraction year with 112 removals
Information That Remains Unclear
- Exact total weight of debris, including sinking material, remains uncertain
- The precise boundaries shift continuously, making exact measurements difficult
- Contribution percentages from different source nations unconfirmed
- Long-term ecological effects of microplastic ingestion not fully understood
- Whether current cleanup rates can eventually reduce overall patch size
- The extent of microplastic impact on marine food webs remains uncertain
- Economic costs of inaction versus cleanup investment not fully analyzed
Why Understanding the Great Pacific Garbage Patch Matters
The Great Pacific Garbage Patch represents a tangible manifestation of global plastic pollution. Its formation reflects decades of increasing plastic production without adequate end-of-life management. The patch serves as both a symptom of broader environmental challenges and a specific target for intervention efforts.
Marine plastic pollution affects ecosystems from the deepest ocean trenches to the most remote beaches. The GPGP concentrates materials that originate from every nation bordering the Pacific, making it an international responsibility despite its specific location. Understanding this phenomenon helps communities recognize how individual consumption choices connect to large-scale environmental outcomes.
The scale of the challenge should not obscure the importance of ongoing efforts. While complete cleanup remains beyond current technological and economic capacity, each extraction represents progress. Organizations like The Ocean Cleanup continue developing more effective approaches, and source reduction initiatives gain momentum worldwide. The path forward requires both immediate action and long-term commitment to changing how society produces and manages plastic materials.
Sources and Perspectives
The Great Pacific Garbage Patch is the world’s largest offshore plastic accumulation zone, located in the North Pacific Ocean between Hawaii and California, within the North Pacific Subtropical Gyre—a swirling system of currents that traps debris.
— The Ocean Cleanup, official documentation
NOAA estimates that 67 ships working a full year would remove less than 1% of the mass. The scale of the GPGP presents extraordinary challenges for traditional cleanup approaches.
— National Oceanic and Atmospheric Administration
Plastic persists with exponentially increasing microplastic concentrations since the 1970s due to ongoing inputs exceeding losses.
— Scientific research consensus on gyre dynamics
The Path Forward
The Great Pacific Garbage Patch continues growing despite unprecedented cleanup efforts in 2024. Understanding its formation, scale, and impacts informs both immediate response strategies and long-term prevention efforts. The phenomenon connects individual consumption choices to global environmental outcomes, demonstrating how materials designed for convenience accumulate in unexpected places.
Reducing single-use plastic consumption represents one actionable step individuals can take. best water bottles with straw alternatives to disposable bottles offer one example of practical substitutions. Supporting organizations working on both cleanup and prevention, advocating for policy changes, and making informed purchasing decisions all contribute to addressing this challenge at its source.
Is the Great Pacific Garbage Patch getting bigger?
Current data suggests continued growth. A June 2025 report confirmed persistent expansion, with estimates ranging up to 3.6 trillion pieces. Despite record extraction years, scientists have not documented significant size reduction. Microplastic concentrations have increased exponentially since the 1970s, indicating that inputs continue exceeding removals.
Can the Great Pacific Garbage Patch be cleaned up completely?
Complete cleanup remains beyond current technological and economic capacity. The scale—approximately 1.6 million square kilometers—and the diffuse nature of debris make total removal impractical. Even with successful scaling of cleanup operations, source mitigation remains essential. The focus has shifted toward significant reduction rather than total elimination.
What countries contribute most to the Great Pacific Garbage Patch?
No single nation claims responsibility due to the GPGP’s location in international waters. Plastics originate from multiple countries across Asia, North America, and elsewhere. The gyre system draws debris from all coastlines within its vast drainage area. Pinpointing exact contributions remains difficult due to the complex mixing of materials from numerous sources.
Is the Great Pacific Garbage Patch visible from space?
Portions of the GPGP are detectable by satellite in areas of highest concentration, particularly where larger debris accumulates. However, the diffuse microplastic nature makes the patch far less prominent than popular imagination suggests. Unlike a visible landfill, the debris is suspended throughout the water column and mixes with ocean surface.
What percentage of the patch consists of fishing nets?
Synthetic fishing nets constitute nearly half of the GPGP’s total mass. This abandoned gear represents the largest single category of debris and poses particular danger to marine life through entanglement. The fishing industry and related maritime operations contribute significantly to the problem alongside consumer plastics.
How much plastic has been removed from the GPGP?
In 2024, The Ocean Cleanup achieved 112 extractions—more trash than all prior years combined. While this represents significant progress, total removed amounts remain a small fraction of the estimated 100,000 tonnes present. Scaling cleanup operations while maintaining efficiency and marine safety remains an ongoing challenge.
Does research link the GPGP to health concerns like bladder cancer symptoms?
While microplastics have been detected in human tissues and research continues into health effects, specific causation between GPGP-derived plastic and conditions like bladder cancer symptoms has not been established. Scientists continue studying how microplastic exposure might affect human health, but direct links to the GPGP specifically remain undetermined.
More related posts
 What Does Collagen Do – Roles in Skin, Joints, Bones
 Krishnan Guru-Murthy – Career, Family and Strictly Facts
 Japanese Head Spa Near Me – Top UK Locations
 Tour de France 2024 – Results, Standings and Highlights
 Matthew Modine Movies and TV Shows – Complete Career Guide 2025
 Very Early Signs of Pregnancy 1 Week – Symptoms, Certainty & When to Test
 How Much is a Cup in Grams – Baking Ingredient Weights
 Wedding Shoes for Bride – UK Guide to 2025 Styles
